Mastering Roasting Profiles with Kaffelogic’s Expert Guide
Learn how to navigate roasting on the core profiles and achieve the perfect roast for you.
What is a profile?
Roasting profiles are the recipes roasters create and then apply to green coffee origins during the roasting process.
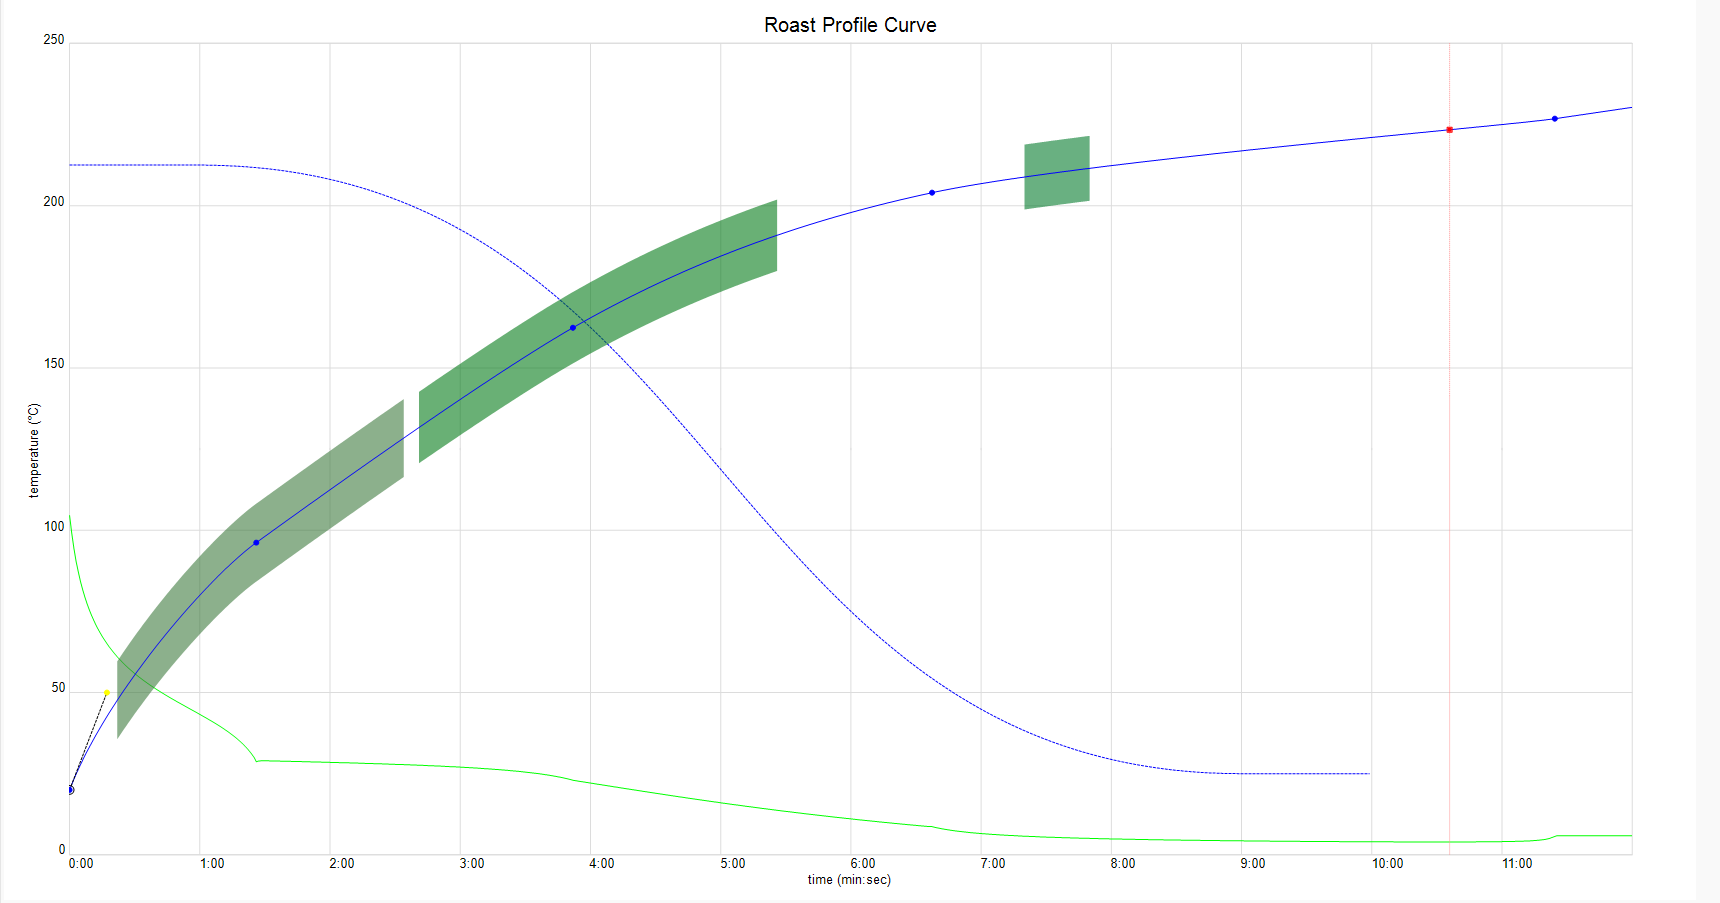
A profile is an X and Y-axis graph where we typically look at time and temperature. We plot the time it takes to reach set temperature points unlike cooking food in an oven or on a bbq, with roasting, you can't pull your coffee out, cut it open and assess your progress. You rely solely on the profile to track the roast.
There are typically three phases included in a roast profile: Drying, Maillard Reaction phase, First Crack phase.
Additional to this is the Development Time Ratio (DTR) phase which is a percentage representation of total roast time calculated from first crack to end.
Within each of these phases, coffee is changing. From the onset of the Maillard phase, the coffee sugars, amino acids and proteins start to break down, with flavour developing.
The roasting profile is critical in recording these changes for future adaption. It does this through recording and deciphering information off the single or multiple probes found in the roaster and positioned close to or in the middle of the bean mass.
This finished profile with a roasting log will help the roaster at the next stage of tasting the coffee to identify planned flavours or lack thereof.
The roaster can now critically review the profile and its above phases and identify where they need to manipulate.
Now it's back to roasting the coffee and assessing.
Without roasting profiles, the roaster is simply turning the coffee brown and has no point of reference to time or temperature. The roaster will struggle for consistency in both colours of the roasted coffee and flavour development.
FIRST TIME SETUP
First time setup and roast straight out of the box.
Profile breakdown
The roaster should strive to, at the minimum, use a reputable roast logging system like Kaffelogic Studio or Cropster. If this is not possible, a piece of paper recording times and temperatures during the roast is suitable. The roasting log is critical when assessing your coffee’s reaction to the profile set for it.
If necessary and after tasting , these logs can be readjusted with the intention of generating better origin flavour.
Drying Phase
When roasting any coffee to any degree it will need to go through the drying phase. When you recieve a coffee it will typically be around 8-12% moisture content and will need to be dried before the development of flavour can begin.
Colour Change
This is the point where the coffee has begun to change colour moving to a brown colour. It also marks the starting point of the Maillard Phase. It is important to remember that the drying phase will continue through this and into the Maillard Phase.
Maillard Phase
This phase begins when the beans start to turn brown and begins the process of flavour development. It begins to reduce sugars and amino acids. This starts to develop the aroma compounds and colour compounds, also called melanoids. This is an important phase for flavour development.
First Crack
This event occurs when the coffee reaches a certain internal temperature point that causes a rapid release of moisture that results in an audible “pop”. This is known as first crack. Coffees of different densities will crack at different temperatures so not all are equal. This marks the start of the development phase.
Development Phase
Once first crack has begun, this is the phase on which you will decide your roast degree. How light or dark you want your coffee is determined here. This is also where the desired aroma compounds are developed. It is important to be very cautious at this stage as a very rapid development can lead to smokey flavours and a very short development can lead to underdeveloped flavours.
Roast End Point
This marks the end point of your roast. Once you have decided on an end degree or development level of your roast this begins the cooling cycle where the unit will stop producing heat and will push the fan to remove heat as quickly as possible to stop the roasting process.
Our Current Core Profiles
KL Classic
This is the default profile, the one that we use for troubleshooting and it gives a good starting point.
The Kaffelogic Classic profile was made to be a good starting point for everyday medium to dark roasts.
The recommended starting level if you are new to roasting and are starting on your coffee journey is level 3.3.
KL Explorer
This is another starter profile for new users to try. It provides another option for those looking to try new profiles and roast styles.
This profile is a modified version of KL Classic, so you can compare and start your journey of learning roasting exploring flavour.
KL Washed and Natural
These 2 profiles were created as more focussed starting points for users wanting to roast for specific processing methods.
These profiles have guides within the About this file tab, helping you to choose a style to roast for.
RTD Profiles
RTD (Ready to Drink) profiles have been developed for those situations where you have just purchased a new green bean, want to make coffee at an occasion, or have run out of roasted beans.
These profiles have been designed for the coffee roasted, ground, and brewed or extracted directly after roasting occurs. Flavour should, on average, carry for the next 2 to 3 days.
Rest Profiles
The “REST” profiles have been developed for maximum flavour results in roasted coffee. They are perfect for those occasions where you are still working your way through a Kaffelogic roasted origin or blend and you know you will have no coffee after 3 to 5 days' time.
These profiles have been designed for the coffee roasted to be rested in airtight containers and allowed to de-gas over 3 to 5 days before the beans are ground, brewed and extracted.
Cupping
The Cupping profile has been developed to roast coffee to a specific point in order to grind and immerse the coffee grounds with water.
The purpose of the profile is to give you the best development result necessary for assessing the defects of the coffee as well as a base origin taste.
You can then determine through assessing the origin taste how best you would like to roast your coffee to achieve your brewing or extraction taste results.
Default Cupping roast level = 2.
Decaf
This profile has been designed to roast a good expression of decaf coffee.
Robusta
This profile has been developed for the roasting of robusta coffees.
Super Dark
This profile has been developed for those users that like very dark, low acidity and high body roasts.
This profile is developed to give you the maximum intensity and smokey flavour from your green beans.
My roast isn’t tasting good, now what?
Not all coffees are the same and they do not all behave the same when roasted. You might find that the profile you have chosen does not suit the coffee that you are trying to roast. With coffee roasting there is a great deal of trial and error involved, there are a few options available to get your coffee to where you want it to be;
You can choose another profile and see if you have better results. You can roast on another one of the core profiles, or you can find one on the community forum if you wish.
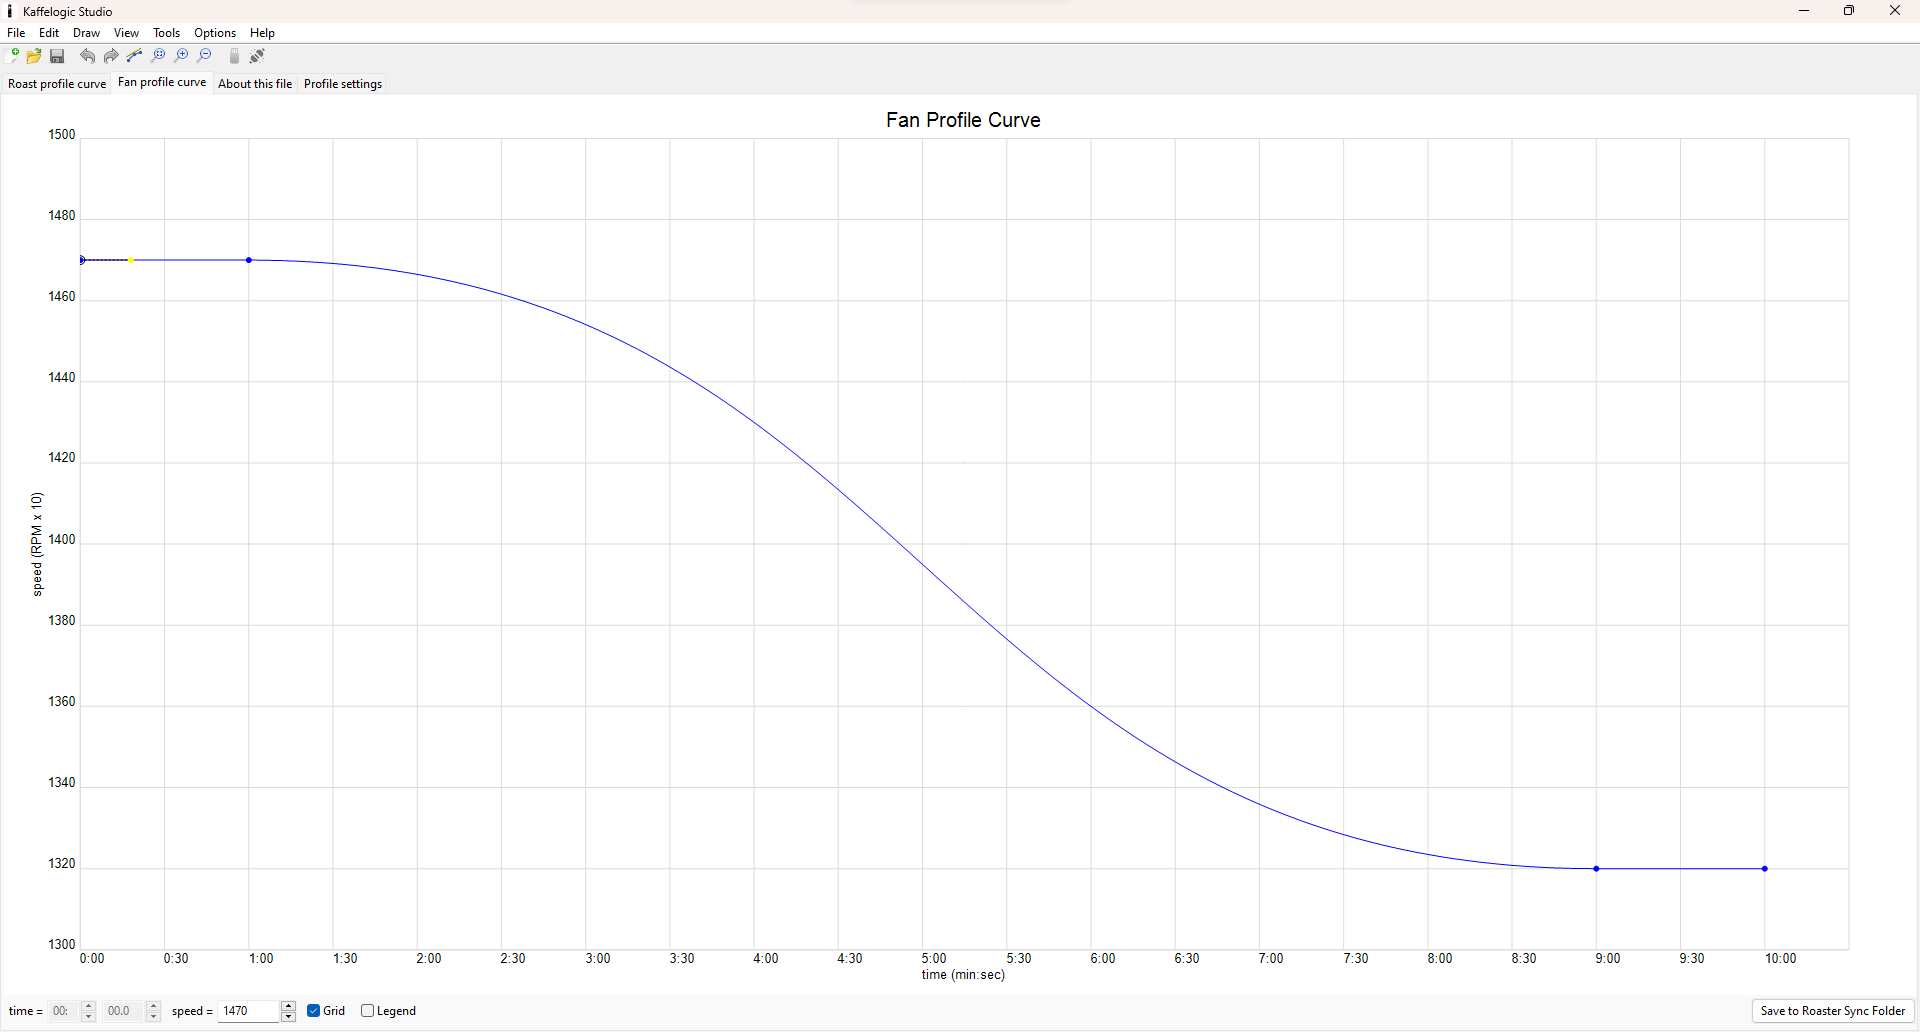
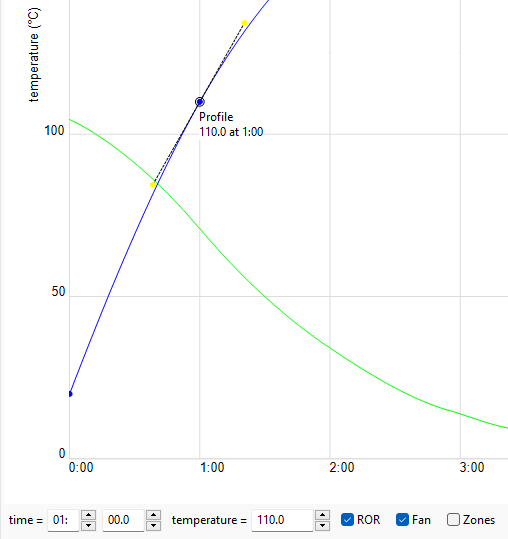
You can tweak a profile in Studio and adapt it to your coffee. By manipulating the bean curve and fan curve you can refine the profile to your coffee. You also have the power to change all available settings in your roast, if you do not see the settings you are looking for then change the difficulty in the ‘Options’ dropdown.
Finally you create a brand new profile by selecting File > New at the top left corner of the screen. You can then change the name and details of the profile in the ‘About this file’ tab. You can also use this space to add in details about your profile, batch sizes, changes, recommendations or cupping notes. This space is intended for you to add any notes that you would like to include with this profile.
I like the style, but it’s a little too light/dark.
If you find that the coffee is tasting either just too light or dark for your taste you can easily adjust this, even during a roast! By using the ‘+’ and ‘-’ buttons you can increase and decrease the level of your roast.
What is a level you ask? Levels are numbers allocated to the end temperature of your roast. On the KL Classic profile level 3 corresponds to 227℃. You can see this at the bottom middle of the Studio window.
Levels allow you to change the end temperature of a roast, either predetermined in Studio, or on-the-fly on the roast by using the ‘+’ and ‘-’ buttons. So if your roast is tasting just a little bit too light, increase the level slightly. If it is tasting a little too dark, decrease the level slightly.
Stuck with something specific?
If you are struggling with something specific or are unsure of what to do next, feel free to contact our support team and get in touch with our resident coffee people where we can help you achieve the roast you are looking for.


